The last time I wrote a market update was January 2021. The market was on fire and my buyers were emotionally exhausted. Low inventory, low interest rates and intense buyer interest over a prolonged period of time led to record high housing prices and many questioning the sustainability of this ‘bubble’. In the months following, it felt like there was no market news I could share that would fairly instil hope in potential buyers. Here we are, well into the summer months. It’s still a tough market, without a doubt. But there’s hope!
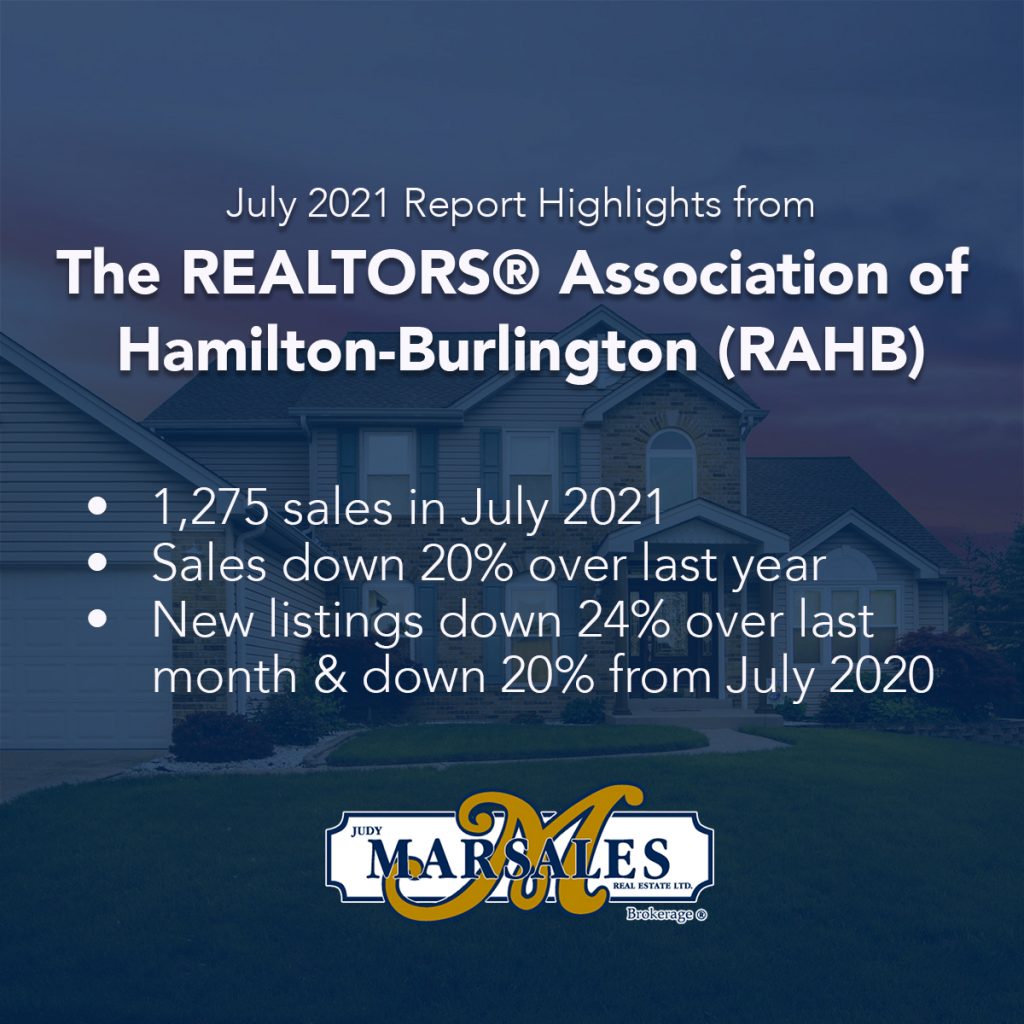
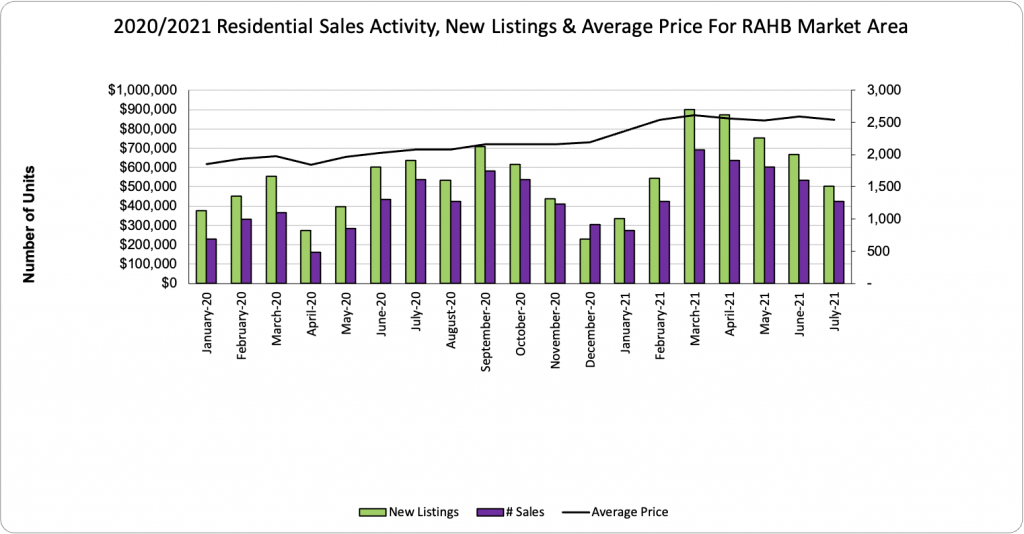
Let’s take a look at July 2021. The REALTORS® Association of Hamilton-Burlington (RAHB) reported 1,275 sales of residential properties located within the RAHB market area. Sales were down 20% since June 2021, and down 20% since July 2020. New listings were down 24% since last month and down 20% year-over-year. The average price for residential properties was $847,104 – a decrease of 2% from last month and an increase of 22% from July 2020.

“Since the pandemic began, the RAHB market area has been anything but predictable and each new month has brought historic highs and lows. Overall this month, we are seeing the number of sales and active listings slightly decrease compared to the previous four months which is inline with seasonal trends. We are continuing to experience high demand coupled with record low inventory in almost all property types which is driving sale prices.” – RAHB President Donna Bacher.
Sales activity and number of new listings are falling but average prices are holding strong.

Let’s look at individual market segments.
Detached property sales decreased by 17% from June 2021 and new listings decreased by 26%. Average sale price held fairly strong with only a 4% decrease to $933,927 as compared to last month. Meanwhile, the number of active listings increased by 17% for the same time period.
Townhouse property sales decreased by 26% from June 2021; new listings decreased by 20% and the average sale price increased by 2% to $735,606. Active listings in this segment have increased by 2% since last month.
Meanwhile, apartment-style xxxx – need RAHB.

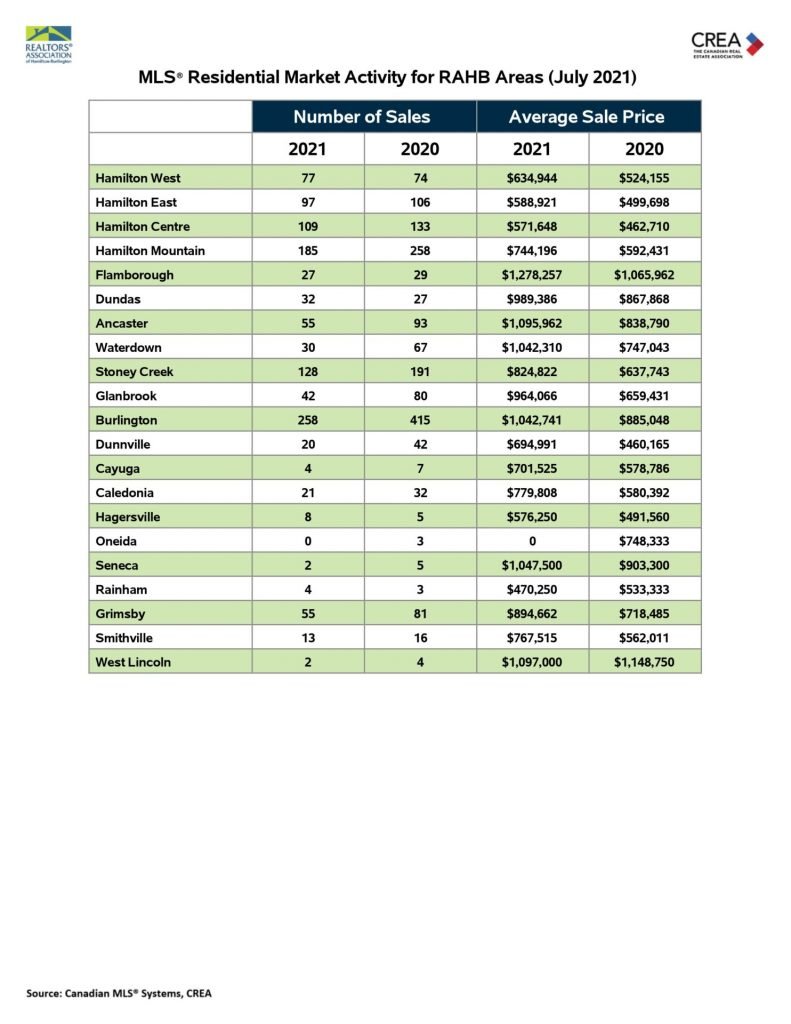
Year-over-year sales within the RAHB market area shows mixed results and can help potential buyers understand the competition they might face. It’s important to remember that average sale price can be useful in establishing long-term trends but should not be used as an indicator that specific properties have increased or decreased in value.
It’s understandably difficult to take in this ever-changing data. I’m here to help as we adjust to reopening protocols and getting ‘back to normal’. If you have any questions, don’t hesitate to reach out, even if you’re not ready to hit the market. Call, text or email me anytime!
