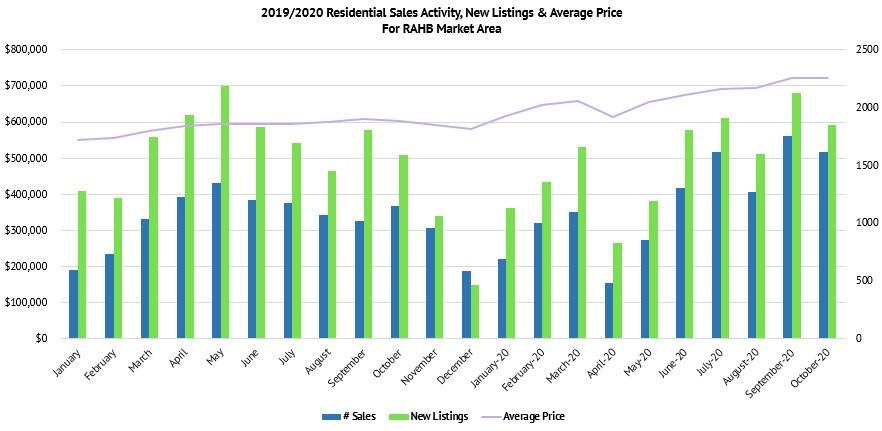
While the number of new listings in the Hamilton/Burlington market area was up 5.5% over October 2019, the number of active listings by the end of October was almost 40% lower than the year previous. This is driving an insane frenzy of buyer interest when you consider that this low inventory is paired with low borrowing rates. It’s keeping me on my toes, let me tell you!
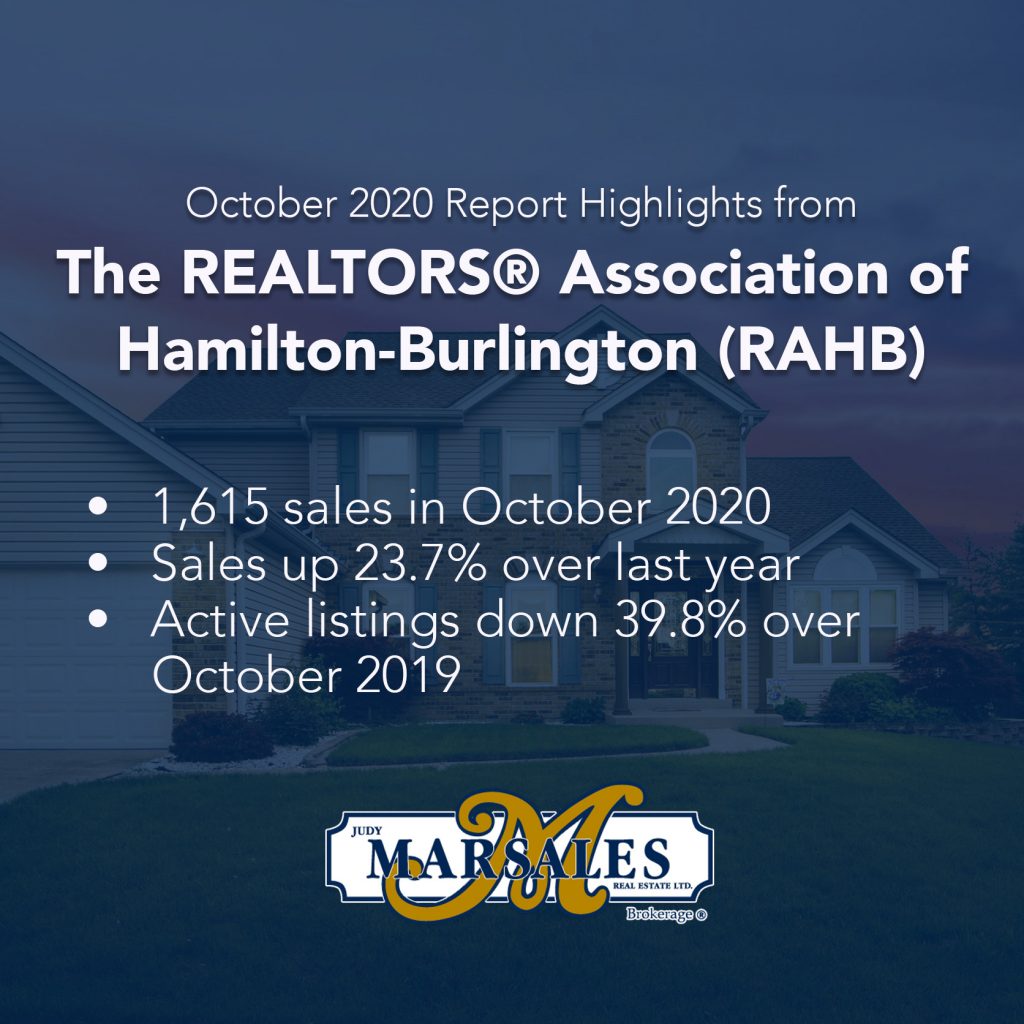
The REALTORS® Association of Hamilton-Burlington (RAHB) reported 1,615 sales of residential properties in October 2020; down 7.6% over the last month and up 23.7% as compared to October 2019. The average price for residential properties was $721,523, an increase of 0.02% from last month and up 19.8% from the same time period last year. Let’s dig in!

“The trends this Fall are not reminiscent of what we would normally see – with October activity slowing slightly compared to September – and this is due to 2020 not being a typical year. As a result of COVID-19, we experienced a delayed Spring market and a surge in record activity over the Summer months when the province began to reopen. As a result of this unstable year, active listings at the end of each month are some of the lowest we’ve seen, exacerbating low inventory levels and continuing to drive average price.” – RAHB President, Kathy Della-Nebbia
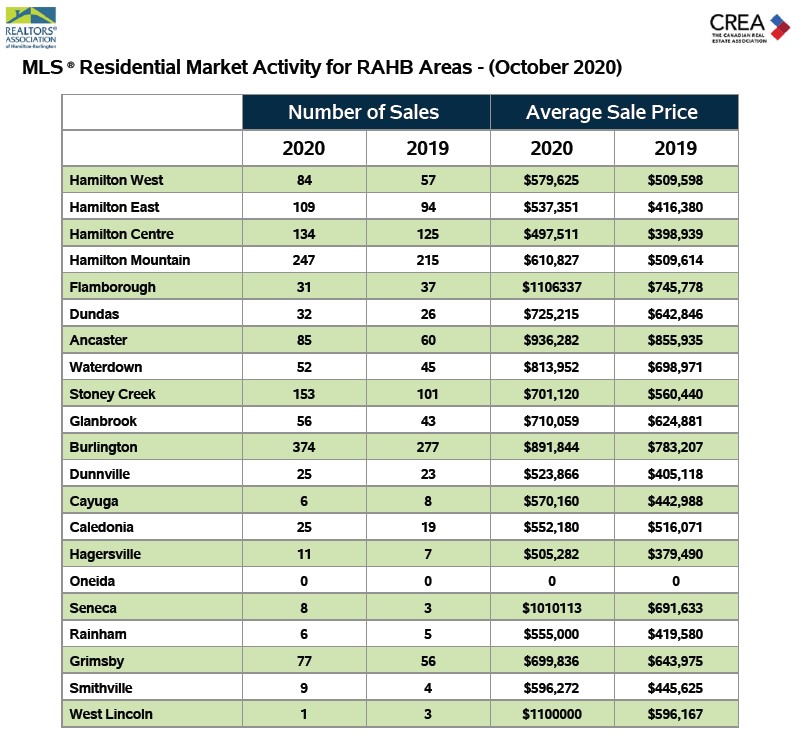
And as always, different market segments have seen different rates of growth depending on location and home type. Top performers in terms of volume of sales were seen on the Hamilton Mountain, Burlington, Stoney Creek and Hamilton Centre. On a year-over-year basis, many areas saw incredible bursts in average sale price such as Hamilton East, Hamilton Mountain, Flamborough, Waterdown and Stoney Creek, whereas others had more moderate growth.

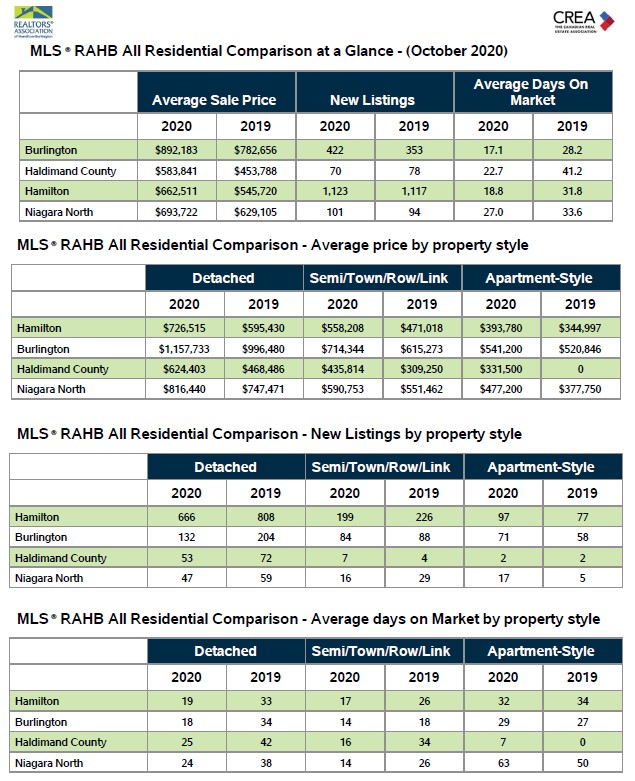
And how does this break down for property type? In September, town homes lead the leaderboard, but in October it’s apartment-style properties that have seen a dramatic shift.
Apartment-style property sales increased by 32.8% from October 2019; new listings increased by 78.8% and the average price increased by 9.7%. Yes, you read that right. 78.8%!
Single family property sales increased by 13.3% from October 2019; new listings decreased by 14.7% and the average price increased by 19.4%.
Meanwhile, townhouse sales as compared to October 2019 increased by 18%, new listings were up 9.1% and the average sale price increased by 16.6%.

“If demand remains high and the economy doesn’t shut down, we may not experience the slow down we saw with the first wave. The activity more likely to slow down is new listings, which will cause a further problem with supply and demand, and prices will continue to increase.” – Kathy Della-Nebbia

It’s understandably difficult to take in this ever-changing data. I’m here to help as we ease into the second wave of COVID-19. We have all the tools we need to make viewings safe, or better yet, completely virtual. If you have any questions, don’t hesitate to reach out, even if you’re not ready to hit the market.
If November weather can’t make up it’s mind, you don’t have to either! Get all the facts before you make a move. Call, text or email me anytime!
